Upgraded User Experience:iBest Software

iBest Introduction
The iBest software is specifically designed for battery test/ production equipment manufactured by Chen Tech Electric.
It seamlessly supports all system features and optimizes system performances.
By continuously gathering users’ feedbacks, CTE keeps upgrading the user experience of iBest software,
including test program editing, program execution, and data analysis.
It significantly facilitates battery test/ production in an efficient and effective way.
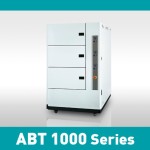
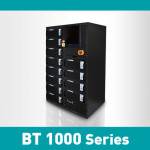
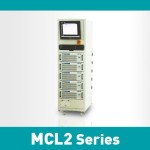
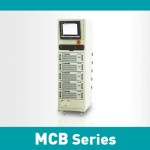
Compatible with the following CTE product series


Simple
Set up test program with few easy steps.
Can be easily operated.
Comprehensive
Provide a variety of test program options
to meet different kinds of testing needs.
- Test modes:
Constant current (CC), Constant current-Constant voltage (CC-CV),
Constant power (CP), Constant resistance (CR), Pulse,
User defined/ Imported Drive Simulation, ACIR, DCIR, Current Ramp, Voltage Ramp. - Step Cutoff Conditions:
Time, EV, EC, ET, mAh, Wh, END mAh , Total mAh, Total Wh, SoC, END SoC,
Ni-MH conditions, Gauge conditions, BMS conditions, Chamber conditions - Protection Mechanism:
OC, LC, OV, LV, OT, Verr, Cerr
Support a variety of international standardized
test patterns. No need to be edited manually.
- Pulse:
Intel Turbo Boost, GSM, PWM - Drive simulation:
FUDS, DST, HPPC - DCIR measurement:
ISO 12405, IEC 61960
Customization
Introduce variable setting functions; supports diverse
charging/discharging test patterns and data recording.
Test programs can be configured freely.
Integration
Control a variety of plug-in modules such as chamber,
Gas Gauge/ BMS data collector, auxiliary voltage, and
auxiliary temperature, eliminating the tedious operation of separate control.
Smart
Multiple convenient current configuration methods such as
C-rate, mAh/g, and current ramp are provided to
speed up the test program editing phase.
Safety
Test curves can be previewed after completing the test program setting.
Set protection criteria for the batteries to avoid any human error that might cause accident.
Confidential
Supports .dbc file import for CANBus communication protocols used for
power battery BMS. BMS data can be collected easily during testing without
revealing the confidential information to CTE.
Control
Includes account management mechanisms,
supports multi-role access restrictions.
Personalization
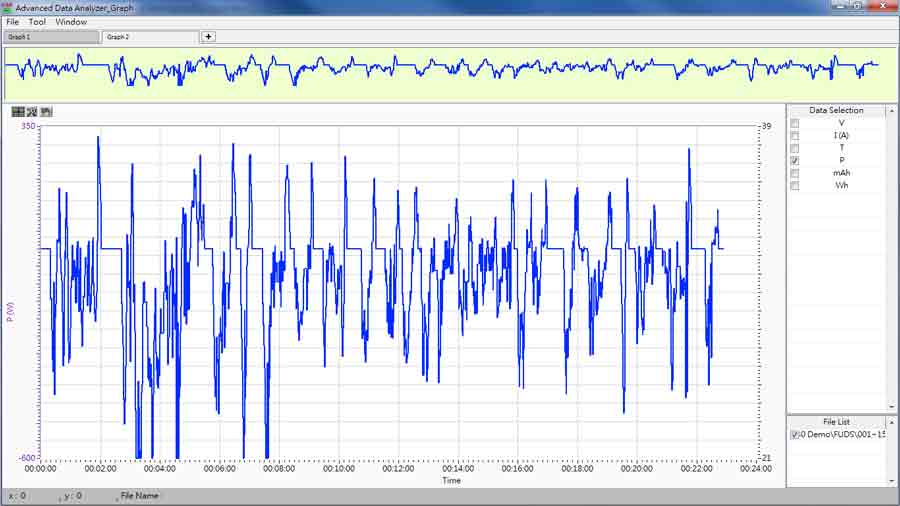
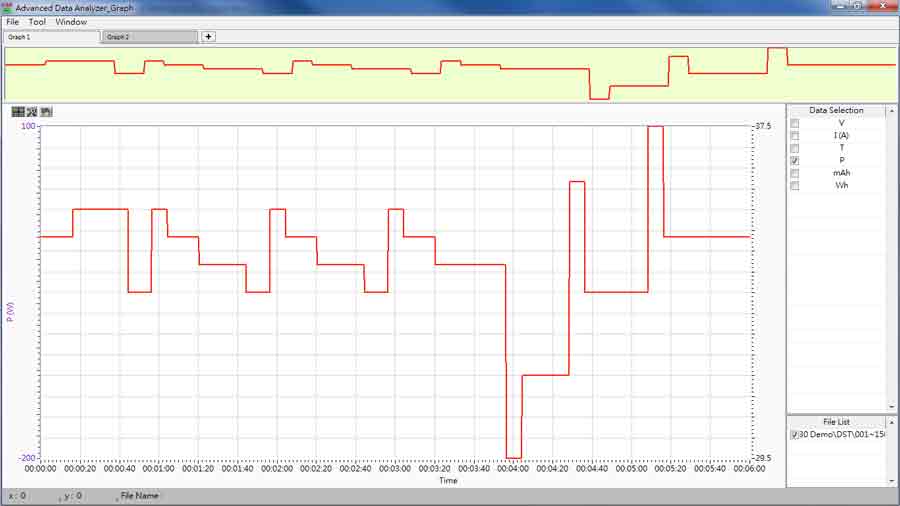
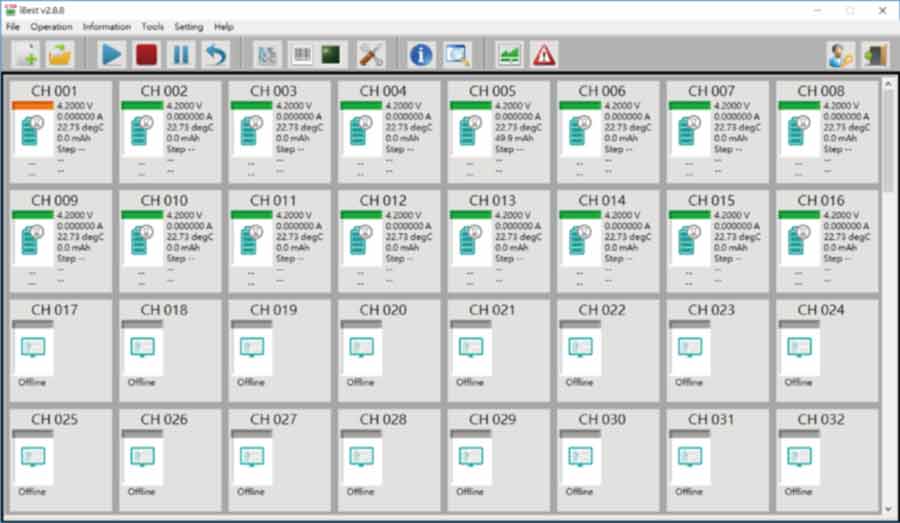
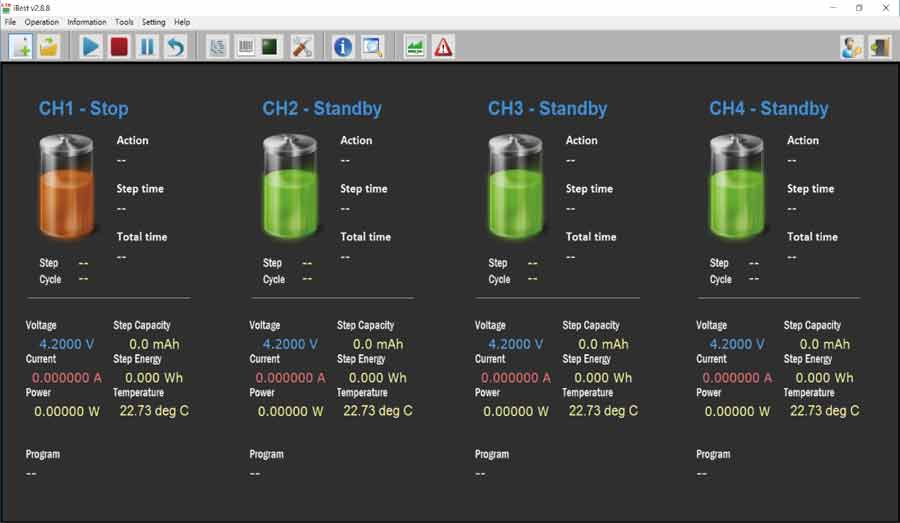
Provides multiple displays of channel status as well as color choices,
which can be configured based on personal preferences and the execution status of the test program (Fig. 1, 2, 3)
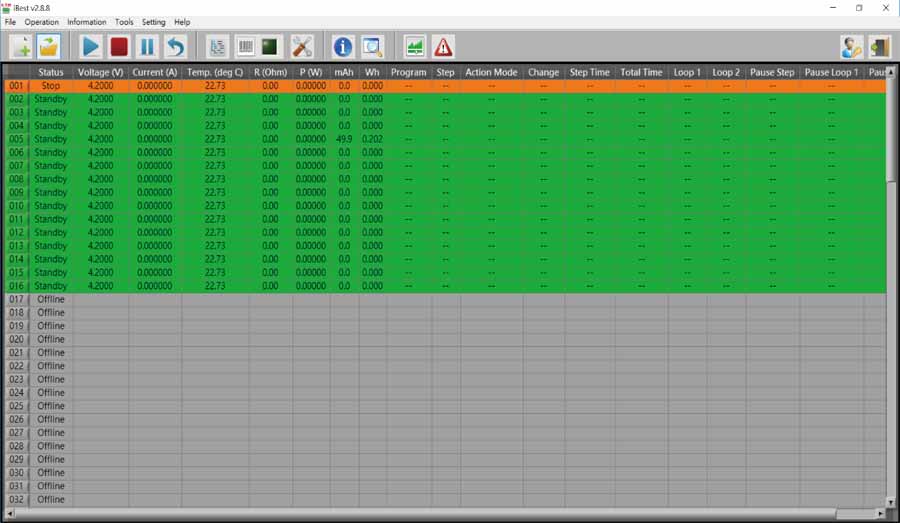
Easy to understand
The main display provides clear information about each testing channel’s current status.
Additional data can be shown on other display panels based on the personal preference of the operator,
no crucial data will be missed.
Immediate
Test data can be viewed in real time.
The program can be adjusted dynamically during the test to rectify any unexpected issue.
Flexible
Supports prescheduled pause functionality;
test program can be halted during specific points in time for personnel inspection and analysis,
no more waiting around.
Efficient
Throughout the testing process,
it is not necessary to link the equipment to a PC for data logging,
enhancing equipment efficiency
Assurance
Following an interruption,
unfinished testing can be continued by connecting to another channel
Time-saving
A variety of test data presentations that can be adjusted according to the needs of researchers, saving data processing time.
- Graphs zoom-in and zoom-out
- Text and graphical reports
- Self-defined X and Y-axis parameters on graphs
Convenient
- Users will be able to choose from a selection of templates for
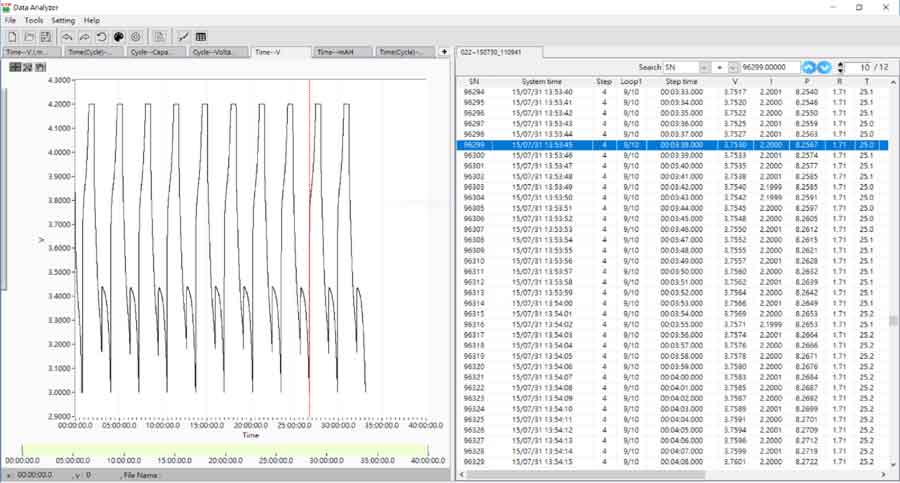
data tables and curve charts available in the system, or create a brand new template based on their requirements. - Testing graphics and raw data can be displayed simultaneously,
cross-reference data mechanisms are also provided.(Fig. 1) - Data retrieval tools allow users to quickly browse important test data.
Professional
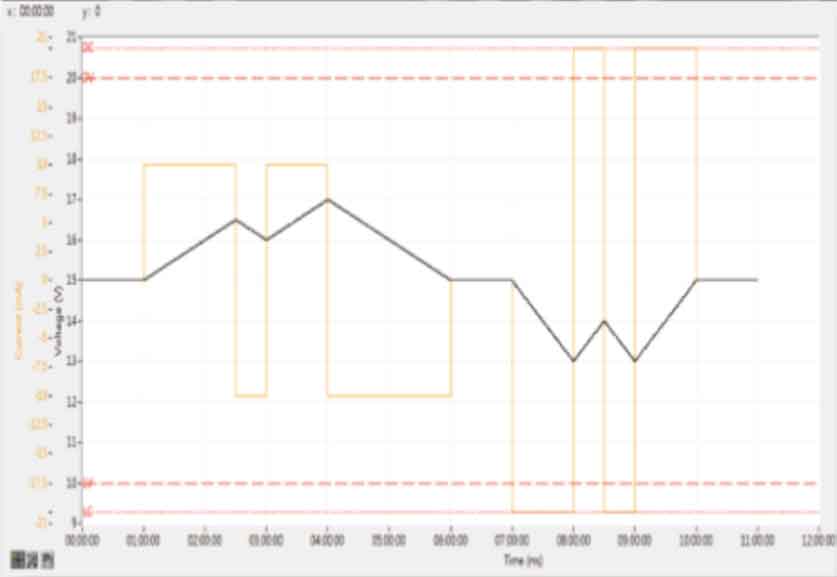
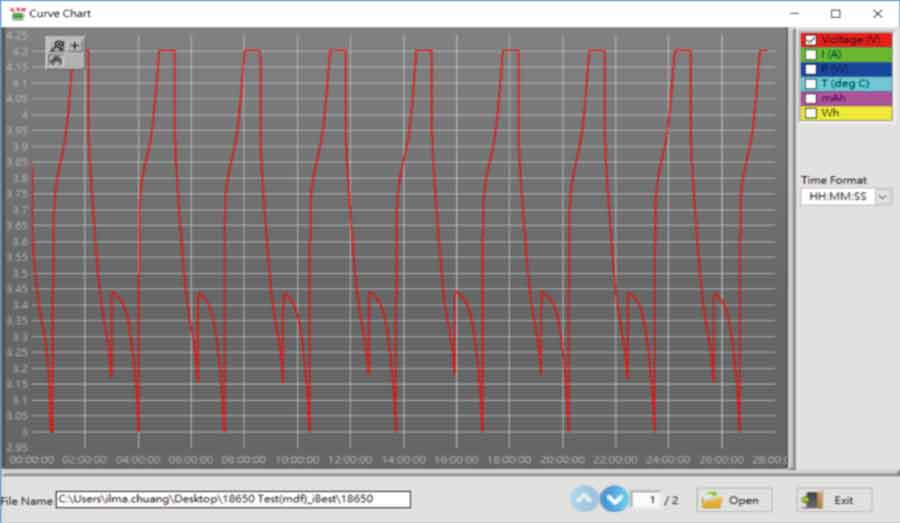
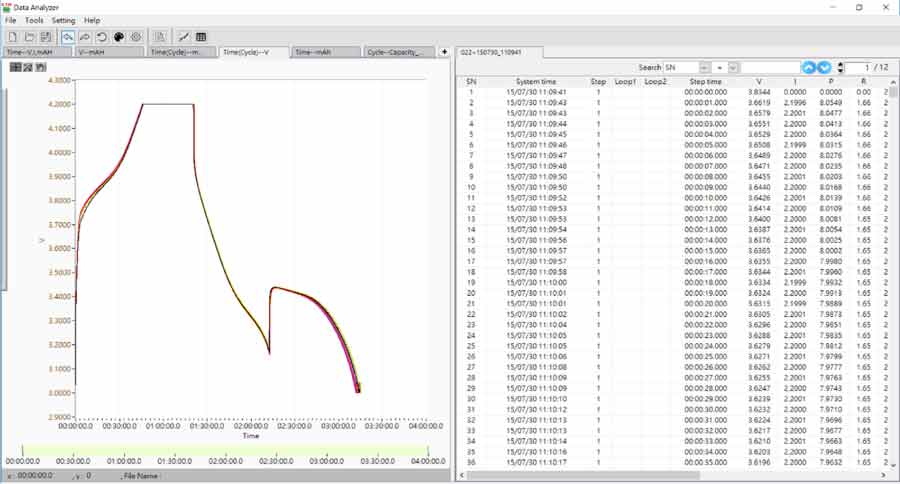
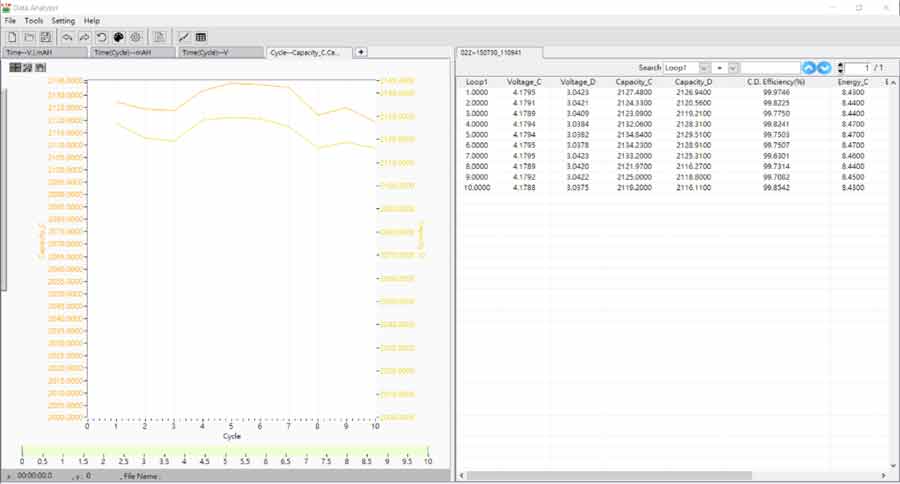
Easily analyze the data from cycle tests. Superimpose the data from each cycle, draw them into charts and produce a lifecycle test report. Help researchers to quickly evaluate the results of lifecycle tests.(Fig. 2, 3)
Compatible
Test data can be exported in .csv format and manipulated in the third-party software that clients are familiar with,
improving the data usability.

